Lab: Latency, sizing and the edge. PLO: PLO1 / PLO2. Points: 7.
Overview
The unit's editors upload about 20 GB of footage a month, and viewers wait for a thumbnail or a video start. The one big idea for this session: latency is not bandwidth. A faster pipe shortens a large transfer only after the first byte arrives; the time before the first useful byte is set by distance, queueing, cache misses and the slowest stage.
The targets from the scenario spine: thumbnail p95 under 200 ms, video start under 2 s; Bangkok p95 under 50 ms, Chiang Mai under 30 ms and Singapore under 80 ms. A p95 is the value 95% of requests finish within, so it describes the tail a viewer actually notices, not the average.
This session measures those paths for real. The unit has no cloud region in Thailand, so the origin sits in DigitalOcean's Singapore region (SGP1) and Cloudflare's edge carries the request from Chiang Mai. The lab also sizes the instance that serves the origin: it benchmarks a small Droplet, deliberately exhausts its memory, and resizes it without growing the disk. The gap between the target and the origin is the lesson; the edge is how the gap is closed.
Lesson
The wait is a path, not a number
A viewer taps a thumbnail. Before a single pixel appears, the request is resolved by DNS, opens a TCP connection, completes a TLS handshake, reaches the nearest edge, checks a cache, and — on a miss — travels to the origin, waits for a queue slot and returns. Each stage adds milliseconds, and the slowest stage decides the experience. The average hides this: if one request in twenty waits for a cold cache and a busy origin, the average barely moves while the viewer feels the stall. That slow few percent is tail latency, and it is why the lab reports p95 rather than a mean.
Two consequences follow. First, measure each phase separately — resolution, connect, handshake, time to first byte — because a single total cannot tell you which stage to fix. Second, a cache is not an optimisation bolted on at the end; it removes an entire section of the path, which is why the edge appears in this session before the CDN is built in Session 4.
Latency versus bandwidth
Bandwidth is bytes per second; latency is time to the first byte. A 15 MB clip on a fast link still waits for the round trip and the origin. Patterson's point is that bandwidth improves faster than latency, so moving more bytes does not make the wait shorter. For media, the first frame and the thumbnail are latency problems; the rest of the download is a bandwidth problem.
This is also why upgrading a link rarely fixes a slow thumbnail. If the request takes 100 ms to travel to Singapore and back, a wider pipe carries the same 100 ms wait. The fix is to move the response closer — an edge cache — or to remove work from the origin.
The memory hierarchy
Every level is a cache for the next one. The legacy System deck's table is still a good map:
Level
Access time
Capacity
Managed by
Registers
1 cycle
1 KB
compiler
L1 cache
2–4 cycles
32 KB
hardware
L2 cache
10 cycles
256 KB
hardware
L3 cache
40 cycles
10 MB
hardware
Main memory
200 cycles
10 GB
OS
Flash
10–100 µs
100 GB
OS
Disk
10 ms
1 TB
OS
The same idea scales out: a CDN edge is a cache for the origin, and a browser is a cache for the edge. A cache hit ends the request at the nearest copy; a miss pays every remaining trip. The hierarchy is about distance as much as speed: registers are close to the core, the edge is close to the viewer.
Edge, origin and the distance to Chiang Mai
DigitalOcean has no region in Thailand. The nearest course region is SGP1 in Singapore, roughly 1,500–2,000 km from Chiang Mai. Light in fibre travels at about two-thirds of the speed of light, so a bare round trip is already in the low tens of milliseconds before any router, queue or disk is involved. Add a TLS handshake, a cache miss and a busy origin, and a 30 ms target is out of reach for a direct origin request from Chiang Mai.
Cloudflare runs points of presence (PoPs) in Chiang Mai (CNX), Bangkok (BKK) and Singapore (SIN). A proxied DNS record does not return the Droplet's address; it returns Cloudflare's anycast address for the PoP that takes the request. Cloudflare picks that PoP by network routing and does not guarantee the closest one, so its trace endpoint reports the actual colo that served the request:
colo=CNX
loc=TH
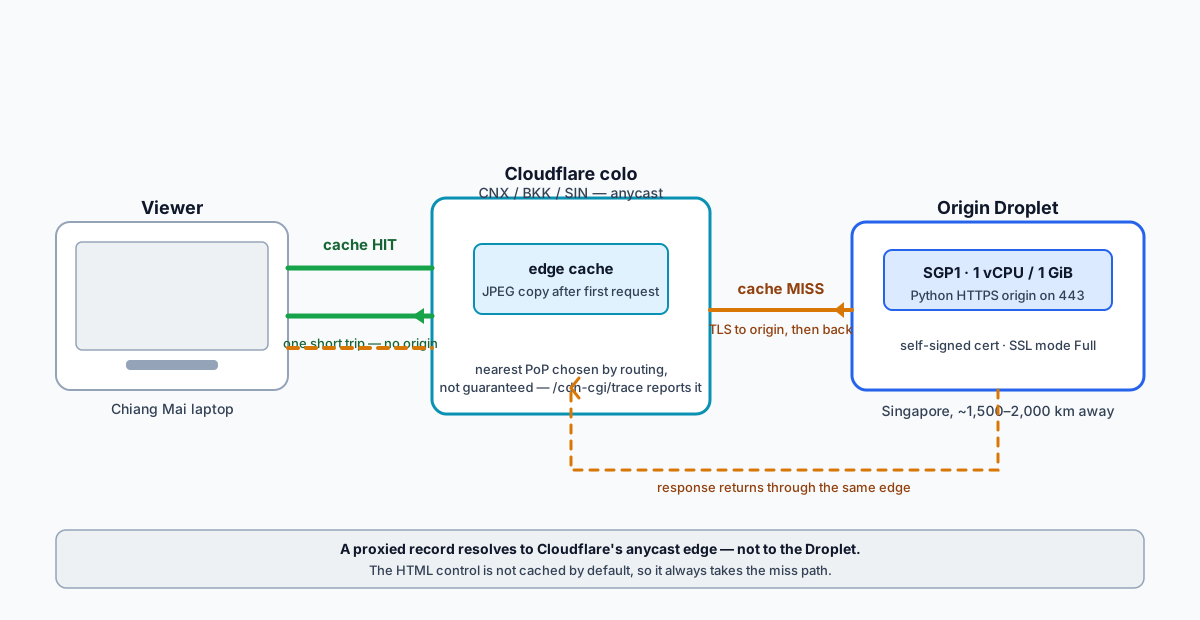
A cache hit is answered at that colo, which removes the Singapore round trip entirely. What remains is the client-to-edge path plus the connection cost: a new TLS handshake adds a few round trips, while a browser's reused connection costs one. The lab measures both states and reports the difference, because a cache cannot remove a handshake. A miss still pays the edge-to-origin path, and its time looks much like a direct origin request plus one extra hop. This is the whole lesson of the session: the edge does not make the origin faster, it removes trips to it.
The origin must speak HTTPS. Cloudflare's SSL/TLS mode decides how the edge talks to the origin:
Mode
Edge to origin
What it proves
Off
HTTP, no encryption
Nothing; never use it
Flexible
HTTP, unencrypted
The edge is encrypted, the origin leg is not
Full
HTTPS, certificate not validated
Encrypted end to end; a self-signed certificate is accepted
Full (strict)
HTTPS, certificate validated
Encrypted end to end; a trusted origin certificate is required
The lab uses Full, because the origin's certificate is self-signed and generated in the Droplet. The certificate encrypts the leg; it does not prove the origin's identity, which is what strict mode would require and what Session 4's custom domain provides. TLS is what makes the second handshake in the latency path necessary — one from the laptop to the edge, and on a miss another from the edge to the origin.
Figure 2.2 — A cache hit ends at the Cloudflare colo; a miss pays the Singapore round trip to the origin.
Reading the figure. The viewer's laptop is on the left, the Cloudflare colo in the middle and the SGP1 Droplet on the right. The upper path is a cache hit: the request stops at the colo and returns without crossing to Singapore. The lower path is a miss: the colo opens a second TLS connection to the origin, waits for the first byte, optionally stores the response, and returns it. The same JPEG takes the upper path after the first request; the HTML control never enters the cache, so it always takes the lower path.
Cache status and the control
Cloudflare caches by file extension by default: .jpg is cached even when the origin sends no Cache-Control header, and .html is not cached. The default edge TTL for a cached object is two hours. That default is what the lab observes, not a special rule.
Three response headers tell the story:
Header
What it means
cf-cache-status
MISS on the first request, HIT once the edge holds a copy; absent or DYNAMIC when the route is not cached
cf-ray
The request's edge identity; the suffix names the colo
age
Seconds the edge copy has been held
The first JPEG request is a MISS, the second is a HIT. The HTML control stays uncached: it has no cf-cache-status: HIT and always reaches the origin. Changing the object later without changing its URL is a stale-content trap; Session 4 owns the purge and versioned-key fixes.
Sizing an instance by measurement
An instance is a virtual machine with a vCPU count, a memory size and a disk. DigitalOcean's Basic plans are shared vCPU: the physical core is time-shared with other customers, and there is no burst-credit balance to spend down. A plan's vCPU number is a promise about scheduling, not a guarantee of a fixed clock. There is no credit meter to watch, so the only honest way to size a workload is to benchmark it on the plan and read what it delivers.
Three measurements make the sizing case:
Single-thread throughput on one worker. It measures one vCPU and is roughly flat across a resize, because the clock does not change.
Parallel throughput on two workers. A plan with two usable vCPUs usually adds close to a second worker's worth of throughput; a one-vCPU plan often stays near the single-worker rate because the two workers share the same core. A shared host can burst above the label, so the measured ratio is the evidence, not the plan name.
Disk read and write throughput with a fixed block size. A CPU/RAM-only resize leaves the disk unchanged, so the numbers should stay close.
The rule for the unit: benchmark the workload on the smallest plan that could work, then resize by CPU and memory only, keeping the disk. A disk can only grow, so growing it is a one-way decision and belongs to the storage session. The lab's --resize-disk=false keeps the original 25 GiB disk and makes the CPU/RAM change reversible.
The failure the instance teaches
The 1 GiB plan has no swap. A process that asks for 1.5 GiB cannot be satisfied, so Python raises MemoryError or the kernel kills the process and leaves an out-of-memory line in dmesg. The workload has outgrown the instance — a concrete failure with a concrete recovery: resize to 2 vCPU / 2 GiB, keep the disk, rerun, and watch a smaller 1.2 GiB allocation succeed. A 2 GB plan does not expose 2 GiB to a process: the kernel and the running system hold part of it, so the recovery proves the ceiling moved, not that every allocation up to 2 GB fits. The lesson is not "buy a bigger plan"; it is that memory is a hard ceiling, and the failure mode tells you which ceiling you hit.
Amdahl's law
Amdahl's law caps the payoff from speeding up one stage. If transcoding is 40% of the pipeline and you double its speed, the pipeline speeds up by 1 / (0.6 + 0.2) = 1.25×, not 2×. The 60% that did not change sets the ceiling. The same arithmetic explains the two-worker benchmark: if the work has a serial part — collecting results, starting processes, writing output — the parallel run cannot reach a clean 2×. Measure the stages before optimising one.
What the lab measures
Lab step
Concept
What to look for
Proxied record and cdn-cgi/trace
Anycast edge and colo
The hostname resolves to Cloudflare, not the Droplet; colo= names CNX, BKK or SIN
JPEG twice, HTML once
Default cache rules
MISS then HIT for the JPEG, no HIT for the HTML
latency.py on three paths
Phases, distance and connection reuse
Origin-direct p95 is far above 30 ms; the cold edge is lower; the warm edge is lower again and may meet 30 ms
bench.py one and two workers
Shared vCPU and Amdahl
Parallel beats single; the speedup is not exactly 2×
dd read and write
Disk is unchanged by a CPU/RAM resize
Throughput stays close across the resize
1.5 GiB then 1.2 GiB allocation
Memory ceiling and recovery
MemoryError or an OOM kill on 1 GiB, then success on 2 GB
Check yourself
Why does a 1 Gbps link not guarantee a video start under two seconds?
A JPEG shows MISS and then HIT on the same URL, while the HTML never shows HIT. What rule explains both?
The origin in SGP1 is 30 ms away from Chiang Mai on a good day. Why can the edge still meet the 30 ms p95 target, and what does the colo tell you when it does not?
The two-worker benchmark on s-2vcpu-2gb does not rise above the single-worker run at all. Is the second vCPU broken? Use Amdahl's law and the shared-vCPU warning in your answer.
The 1 GiB Droplet cannot allocate 1.5 GiB. Name the ceiling that failed, the command that proves it, and the resize that recovers it. Why does the recovery test 1.2 GiB rather than 1.5 GiB?
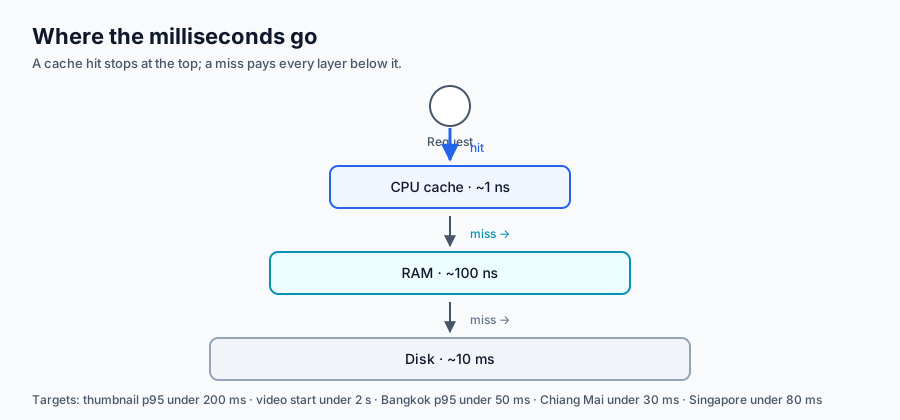
The layered stack shows the CPU cache, RAM and disk. Switch between a cache hit and a miss and watch which path carries the request. The stack is the same hierarchy the memory table lists, drawn as a path: the request stops at the first level that holds the data.
Drag to orbit, scroll to zoom. Switch between a cache hit and a miss.
Reading the scene. The CPU cache is the smallest and fastest layer, and a hit ends there. A miss continues to RAM, and a deeper miss reaches the disk, each layer adding capacity and latency. Figure 2.2 scales the same idea out to the edge and the Singapore origin: the edge is the first cache, and a miss continues across the network to the Droplet.
A static version of the same diagram is available if WebGL is unavailable.
Prerequisite: A root domain registered and an Active Cloudflare zone for it; a DigitalOcean scoped token with droplet:update. Set it up in Session 0: Domain, Accounts.
Prerequisite: the S1 account and project, the course-s1-<id> SSH key and the root domain you registered in S1 self-study. The Cloudflare zone must be Active before this lab, because step 3 puts s2.<root> behind the edge.
You need to know: latency is time to the first byte; bandwidth is bytes per second; a faster link does not shorten the wait before the first byte. A p95 is the value 95% of requests finish within, so it describes the tail rather than the average. DigitalOcean has no region in Thailand, so the origin is in Singapore (SGP1) and Cloudflare's edge carries the request from Chiang Mai. A Basic Droplet shares its vCPU with other customers and has no CPU-credit balance; benchmark it to learn what it delivers. Cloudflare caches a .jpg by default and does not cache .html by default. SSL mode Full encrypts the edge-to-origin leg but does not validate the origin certificate.
Safe-data acknowledgement: I have read the lab safe-data policy. I will use only the course-supplied synthetic media and will not upload real personal media to any cloud service.
Task
Put one 1 GB Rocky Linux 10 Droplet in SGP1 behind a proxied s2.<root> record with SSL Full. Measure the same JPEG from the origin and through the edge, watch it go MISS → HIT while the HTML control stays uncached, benchmark the CPU and disk, exhaust the instance's memory, resize it to 2 vCPU / 2 GB without growing the disk, and rerun.
Work from the downloaded week folder. Commands marked Laptop run on your machine; commands marked Droplet run after you SSH in. Panel paths sit beside the CLI step where both exist. A step with no CLI path says so.
Steps
1. Pre-flight and token regeneration
Start with the zone and the account, then regenerate the S1 token. The S1 token cannot be edited, so the resize later would be refused with a 403. That refusal is the lesson: create a new token with the extra scopes and delete the old one.
Panel: Cloudflare dashboard → your zone → check Active. DigitalOcean Control Panel → API → Tokens & Keys → Generate New Token.
Create course-s2-<id> with the S1 scopes plus two more:
Set the expiry to 90 days and copy the secret once. If doctl does not recognise the new token, add it as a context; the macOS config path differs from Linux.
Laptop:
export DIGITALOCEAN_ACCESS_TOKEN=<new-token>
doctl account get
doctl account get proves the token works and returns the account status. The token value is a credential: never paste it into a file that enters the repository, and keep the config at chmod 600.
Laptop:
dig NS <root> +short
doctl projects list --format ID,Name
doctl compute ssh-key list --format FingerPrint,Name
dig NS must return exactly two Cloudflare nameservers. doctl projects list gives the <project-uuid> to attach the Droplet to; doctl compute ssh-key list gives the <fingerprint> of the course-s1-<id> key you created in S1.
Panel: delete the old course-s1-<id> token. The new token keeps the same least privilege plus the resize scopes.
2. Create the week-2 firewall
S1's firewall is attached by the tag week:1; this lab owns a separate rule set, so a changed laptop IP does not depend on the old rule.
Laptop:
doctl compute tag create "week:2"
A cloud firewall can only reference a tag that already exists, so create the tag first. Step 3's Droplet carries it, and the firewall applies as soon as the tag is attached.
Panel: Manage → Tags → Create Tagweek:2, then Networking → Firewalls → Create Firewall — name course-<id>-s2, inbound TCP 22 from your current IP only and TCP 443 from anywhere, outbound all, applied to the tag week:2.
MYIP resolves your public address, so SSH is open only to you. Port 443 is open to everyone because Cloudflare's edge connects from many addresses, not one. The output is the <firewall-id>.
Laptop:
doctl compute firewall get <firewall-id> -o json > data/firewall-rules.json
Save the rule set as evidence: the inbound SSH source and the 443 rule are what the marker checks.
3. Create the Droplet
Panel: Droplets → Create Droplet — course-<id>-s2, region SGP1, image Rocky Linux 10 x64, plan Basic / 1 vCPU / 1 GB / 25 GiB, the course-s1-<id> SSH key, tags course:42-05-0112, student:<id>, week:2, project course-<id>.
--region sgp1 is DigitalOcean's nearest region to Thailand; there is no Thailand region. --wait returns when the Droplet is active. The command prints the <droplet-id>.
Laptop:
doctl compute droplet list -o json > data/droplet-before.json
doctl compute droplet get <droplet-id> --format PublicIPv4 --no-header
The JSON is the "before" inventory. The second command prints the <droplet-ip> you use for SSH and for the origin leg of the latency test.
4. Add the proxied record
Panel: Cloudflare dashboard → DNS → Records → Add record — type A, name s2, IPv4 address <droplet-ip>, proxy status Proxied, TTL Auto. There is no CLI path in this lab; the API-token path is an extension in Session 4.
Laptop:
dig +short s2.<root>
The answer must be Cloudflare anycast addresses, not <droplet-ip>. If it returns the Droplet address, the record is not proxied: edit it and switch the orange cloud on. Propagation is usually seconds.
API-token extension (reference runner only). The panel path is the student path. The reference runner has no browser, so it creates the same record with a scoped Cloudflare token and records the API call in its command log.
If Rocky's host firewall is active, open 443 inside the VM as well. The DigitalOcean cloud firewall is the outer filter; this is the inner one. A host with firewalld blocking 443 returns 522 at the edge.
Create the served directory and the HTML control. It has no cache-friendly extension, so Cloudflare will not cache it by default; it is the comparison for the JPEG.
Generate a self-signed certificate for the hostname. Cloudflare's Full mode accepts it because Full encrypts but does not validate; Full (strict) would reject it. The certificate is temporary by design.
Laptop (open a second terminal, stay in the week folder):
Upload the synthetic JPEG under a unique name and the origin server. The JPEG is the cacheable object; the unique name keeps your run out of another student's edge copy.
Start the HTTPS server on 443. The curl uses -k because the certificate is self-signed; it must print 200. A 000 means the server is not running; read serve.log.
The token needs Zone:Zone Settings:Edit. The runner records the previous mode and restores it at teardown, because a shared demo zone may serve other hostnames.
The first request arrives at the nearest colo, misses, fetches the origin and stores the JPEG. Expect cf-cache-status: MISS and HTTP 200. A 522 means the edge could not reach the origin: check the Droplet's server and its host firewall.
The HTML control has no HIT: Cloudflare does not cache .html by default, so this request reaches the origin every time. A missing header is the expected result, not an error.
/cdn-cgi/trace is answered by Cloudflare itself. colo= names the PoP that served you — CNX, BKK or SIN in this region — and loc= the country Cloudflare inferred. Cloudflare chooses by routing, not by geography, so record what you actually got.
The origin path connects directly to Singapore and uses --insecure-origin because of the self-signed certificate. The edge path connects to the colo. Each row splits the request into DNS, TCP connect, TLS and time to first byte; total_ms is the wall time. Ten samples per path are the minimum for a p95.
--warm-edge adds a third block, cloudflare-edge-warm: ten requests on one kept-alive connection. A browser reuses a TLS connection after the first request, so this block is the viewer's steady state. The cloudflare-edge block is the cold start, and the difference is the handshake and connection cost that a cache cannot remove. On the reference network the cold edge p95 sat near 70 ms and the warm p95 near 15 ms; both are below the 145–150 ms origin path. The warm block is the one that can meet the 30 ms target; the cold block pays the handshake that a cache cannot remove.
The first row is one worker on one vCPU; the second is two workers. On s-1vcpu-1gb the two workers share the advertised vCPU, so the parallel rate usually stays close to the single rate; a shared host can also burst above it. After the resize the second vCPU may or may not add a clean multiplier. Record what you get and explain it; the resize's hard proof is nproc, free -h and the memory recovery, not a CPU ratio. Copy both CSV rows into data/benchmark_measured.csv.
Write and read a 1 GiB file with direct I/O. oflag=direct and iflag=direct bypass the page cache, so the MB/s figures describe the disk instead of RAM. Without them the read measures memory and looks unrealistically fast. Record the MB/s lines: this is the disk baseline the resize must leave unchanged.
9. Exhaust the memory
Droplet:
free -h
swapon --show
Confirm the plan has about 1 GiB and no swap. With no swap, the ceiling is hard.
Ask for 1.5 GiB on a 1 GiB machine. Python raises MemoryError or the kernel kills the process; either result is the deliberate failure. dmesg shows the out-of-memory line when the kernel ends the process. Save the output.
10. Resize without growing the disk
Panel: Droplets → course-<id>-s2 → Resize → CPU and RAM only → s-2vcpu-2gb. Do not tick "Resize disk". There is also a CLI path.
--resize-disk=false keeps the 25 GiB disk and makes the change reversible; a disk can only grow, so growing it is a one-way decision owned by the storage session. The action powers the Droplet off and on. If it comes back off, start it.
A 1.2 GiB allocation now succeeds. It is deliberately below the 1.5 GiB that failed: a 2 GB plan reports about 1.7 GiB usable after the kernel's own memory, and the running system already holds a few hundred megabytes, so 1.5 GiB can still be refused. The proof is that the ceiling moved and the disk size is still 25 GiB; it is not a claim that every allocation up to 2 GB fits.
The resize powered the Droplet off, so the in-memory server from step 5 stopped. Restart it before rerunning the measurements; the 200 proves it is serving again.
Rerun the CPU and disk measurements. Single-thread throughput is roughly flat; two-worker throughput should now approach twice the single-worker rate because the second vCPU is usable. Disk throughput stays close.
12. Fill the notebook and assemble the evidence
Put your latency rows in data/latency_measured.csv and your benchmark rows in data/benchmark_measured.csv, then open the lab notebook. The notebook computes p50/p95, marks both paths against the 30 ms target, reads the cache result, checks the resize, and writes latency_results.json. It runs offline on the bundled samples if you use the fallback.
Delete both resources. A deleted Droplet stops billing; a detached volume would not.
Laptop:
doctl compute droplet list -o json > data/droplet-after.json
doctl compute firewall list -o json > data/firewall-after.json
doctl balance get
Both lists must be [], and the balance proves the account returned to its starting state. Panel: DNS → delete the s2.<root> record. Keep the project, SSH key, token, zone and spend alert for later sessions.
API-token extension (reference runner only). The runner deletes the record and restores the previous SSL mode:
strict is the value a shared demo zone normally carries. A student zone can keep full or go strict once it has a trusted origin certificate in Session 4.
Evidence bundle
Ten items, scored 3/2/1/0:
data/latency_measured.csv and the p95 chart from the notebook.
The /cdn-cgi/trace output showing the serving colo.
The benchmark table with lscpu, free -h and df -h, before and after the resize.
The cache headers for the JPEG (MISS then HIT) and the uncached HTML control.
The memory-failure log and the post-resize success.
A redacted screenshot of the proxied record and the SSL mode; no token, account ID or email visible.
The sanitized command log.
The empty droplet and firewall lists plus doctl balance get.
latency_results.json from the notebook.
A 150–250-word what this proves note.
Cost ceiling
Under $0.10. The run is one s-1vcpu-1gb hour ($0.00893) and one s-2vcpu-2gb hour ($0.02679) at most; the measurement itself takes minutes. The domain is paid once in S1 and is not part of this ceiling.
Teardown list
Droplet course-<id>-s2 deleted.
Firewall course-<id>-s2 deleted.
DNS record s2.<root> removed.
No volume, snapshot or reserved IP created.
Project, SSH key, scoped token, Cloudflare zone and spend alert kept.
Failure and recovery
Symptom
Likely cause
Fix
dig +short s2.<root> returns the Droplet IP
Record is not proxied
Edit the A record and enable the proxy
curl https://s2.<root>/... returns 522
Edge cannot reach the origin
Check serve.py on 443, the Droplet's firewalld, and the cloud firewall's 443 rule
The resize returns 403
The token lacks droplet:update
Regenerate the token with the S2 scopes; this is the step-1 lesson
The second JPEG still says MISS
The cache key changes, or the colo changed
Use the same URL; read cf-ray to see the colo; the edge may not have stored it yet
MemoryError never appears
The allocation touched swap or a larger plan
Confirm free -h shows ~1 GiB and swapon --show is empty
The two-worker rate does not rise
One vCPU plan, or the workload is serial
Recheck nproc; use Amdahl's law in the note
Fallback chain. Inactive zone: use the instructor demo hostname for the edge and cache items, and say so in the note; the origin-direct measurement is unaffected. doctl blocked: use the Control Panel checklist and record the panel paths. Outbound probes blocked: use the bundled sample CSV and the published measurements. Cloudflare unavailable: measure the origin only and label the missing edge item. The evidence shape does not change; every substituted item is named.
Notebook
Open the lab notebook; it loads the bundled samples, accepts your measurements, asserts the shape, and writes latency_results.json. The reference run executes it headlessly on Python 3.14.2 with pandas 3.1.1, numpy 2.5.4 and matplotlib 3.11.2; it exits 0 and every assertion passes.
Downloads for this session
Each document name opens a rendered view you can read in the browser. The download link beside it gives you the raw Markdown working file: the copy you edit, run and submit. The page above and the lab steps carry the teaching.
The runnable notebook that produces the lab's numbers.
Research question
Design a tail-latency budget for the unit's thumbnail and video-start paths, and explain where each millisecond goes.
Submit an 800–1,200 word answer with 5–8 sources at the next session. The rubric and the exemplar guidance show the expected shape.
References — Session 2
Dean, J., & Barroso, L. A. (2013). The tail at scale. Communications of the ACM, 56(2), 74–80. https://doi.org/10.1145/2408776.2408794
Why the slowest requests, not the average, decide whether interactive media feels responsive; the open problem is tail-aware autoscaling that ports across providers. No essential figure; the queueing argument can be rebuilt as a latency scene.
Patterson, D. A. (2004). Latency lags bandwidth. Communications of the ACM, 47(10), 71–75. https://doi.org/10.1145/1022594.1022596
The course's core performance claim: bandwidth improves faster than latency, so moving media bytes still costs time. The argument predates 4K/8K and volumetric media; the chart is a good redraw candidate.
Barroso, L. A., Hölzle, U., & Ranganathan, P. (2019). The datacenter as a computer: Designing warehouse-scale machines (3rd ed.). Synthesis Lectures on Computer Architecture. https://doi.org/10.2200/S00874ED3V01Y201809CAC046
Explains utilization and the economics behind the instance sizes in the benchmark. Warehouse-scale design is studied for web serving; media-specific accelerator utilization is less understood. Figures need redrawing or a licence.
Teaching note. Narrate Dean & Barroso (2013) for 5–8 minutes, assign the recent paper's abstract, and close by restating the open problem as the weekly question. Figures are third-party; redraw by default.
PLO — Session 2: Performance and latency
CLO: By the end of this session, the student can set a tail-latency budget for a media path, measure which stage consumes it, and size an instance by measurement rather than by plan label.
PLO
Role
Research answer
Lab evidence
Points
Evidence
Rubric
PLO1
primary
4
3
7
An 800–1,200-word tail-latency budget with 5–8 sources; the latency table with its colo, the origin-versus-edge p95, the cache MISS → HIT, the memory failure and the disk-preserving resize
Research 4/3/2/1; Lab 3/2/1/0
PLO2
secondary
0
0
0
Lecture context only; not scored
—
Total
4
3
7
Total: 7 points
Four-level descriptors
Research (4/3/2/1). 4 = a clear budget with p95 targets, a stage-by-stage split, a measurement plan and a counterargument about tail amplification. 3 = a sensible budget with some measurement and one under-analysed stage. 2 = describes latency and bandwidth but does not set a budget or propose a measurement. 1 = a summary with fewer than five sources or no argument. 0 = nothing submitted or misconduct.
Lab (3/2/1/0). 3 = origin and edge are measured with the colo recorded, the cache MISS → HIT and the HTML control are explained, the memory failure and the disk-preserving resize are shown, teardown and cost respected. 2 = measurements are mostly complete but one comparison is missing or thin. 1 = partial measurements and incomplete teardown. 0 = nothing submitted, unsafe data, or no teardown.
The full course arithmetic is in production/baseline.md; this file is the weekly instance.